Client Jel SertSite 501 Conde St, West Chicago ILMonitoring Utility main, 8–13 AugDarkHawk Industrial Energy
00Summary
The short version, before the detail.
Monitoring at the utility main showed a clean supply with no disturbance on the dates the Line 7 surge protectors failed, which localizes the failures to Line 7. A site walk then identified a group of single-phase 480 V transformers on the Line 7 bus, one of which shows encapsulating resin weeping from the enclosure — physical evidence of sustained overheating. It sits directly downstream of the blown machine fuse.
The working hypothesis is that these phase-to-phase windings act as inductive chokes to transients, distributing transient energy unevenly across the Line 7 bus. Verification is through two targeted logging sessions on the Line 7 bus duct, with thermal scanning of the transformers under load and insulation resistance testing if warranted.
01What we found
Tap any finding to see what it means.
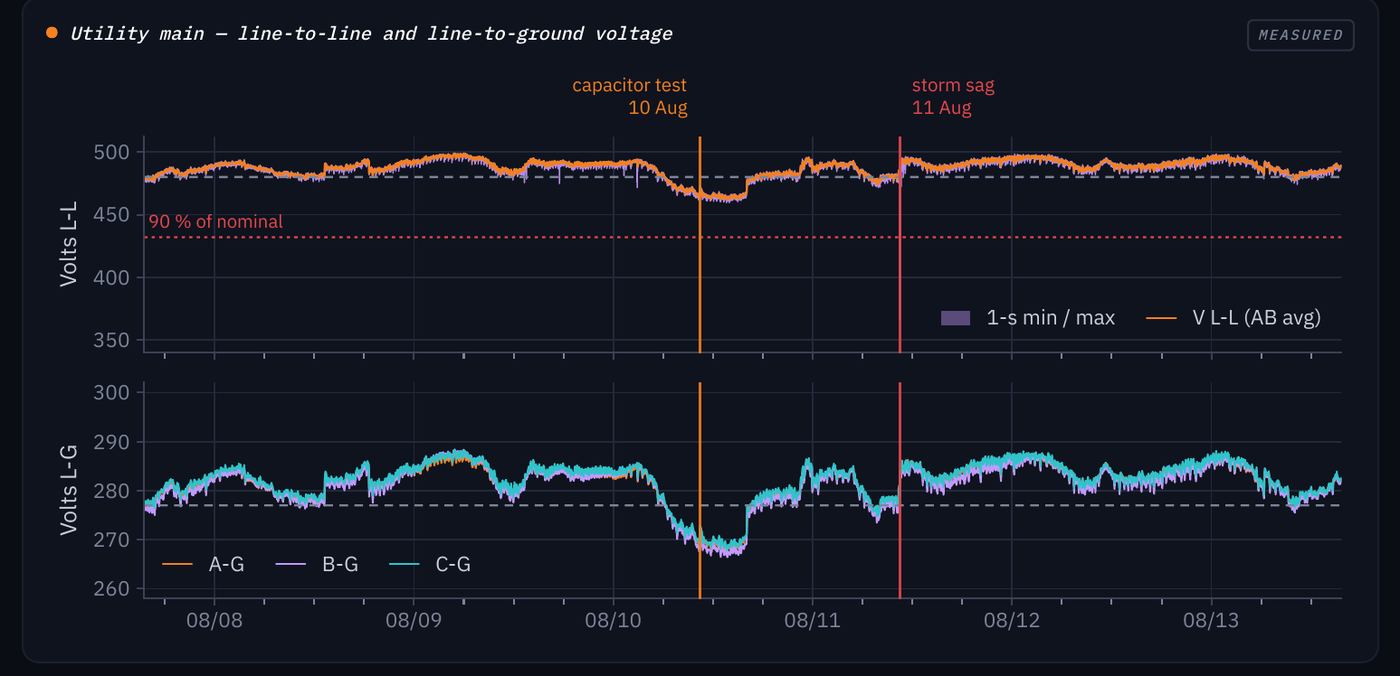
WHAT IT MEANSNot a case of bad power arriving at the building. 519,161 one-second records at the utility main; one sag below 90% of nominal, during the storm on 11 Aug. No flagged intervals otherwise.
WHAT IT MEANSThe cause is local to Line 7. Both SPDs failed at the Rennco 1 and 3 taps. They are Mersen STXR480D05 — the correct delta variant for ungrounded 480 V, so this is not a specification error.
WHAT IT MEANSA single event, not an ongoing condition. It blew on the phase with no transformer winding attached.
WHAT IT MEANSResin only leaks when a transformer has run badly overheated. Encapsulating resin does not flow at normal operating temperature, so extrusion indicates sustained overheating well beyond rated rise, with probable degradation of the winding insulation.
WHAT IT MEANSA real concern, checked and ruled out. Line-to-ground voltages stayed balanced throughout the monitoring period.
WHAT IT MEANSNo fix is available from the utility. Protection has to be on your side of the meter.
02Supply data at the utility main
What the analyzer recorded, 8–13 August.
Utility main — line-to-line and line-to-ground voltageMEASURED
Figure 1. Line-to-line voltage with one-second min/max band (top) and line-to-ground voltages (bottom). Orange marker: controlled capacitor switching test, 10 Aug. Red marker: storm sag, 11 Aug. Tap to enlarge.
SUPPLY QUALITY
Clean. 519,161 one-second records; one sag below 90% (storm, 11 Aug); no flagged intervals
GROUND FAULT
None. Line-to-ground voltages balanced throughout
SCOPE OF FAILURES
Line 7 only. Both SPDs on the Line 7 bus duct failed, at the Rennco 1 and 3 taps
SPD LOCATION
Mounted directly on the bus duct, upstream of the machine fuses
FUSE FAILURES
One fuse, in the Line 7 machine, first occurrence. Blown on the phase with no transformer winding. No recurrence since replacement
SPD SPECIFICATION
Mersen STXR480D05 — correct delta variant for ungrounded 480 V
CAPACITOR SWITCHING
Ongoing contributor to transient duty on this feeder. No utility remedy available
SERVER / DATA EQUIPMENT
Separate issue. Failed breaker on low side of double-conversion UPS, Gear B. Excluded
03Line 7 single-phase transformers
At least four fed from the Line 7 bus duct. The unit below is the first load directly downstream of the machine fuse that blew, and the only one of the four showing distress.
MANUFACTURER
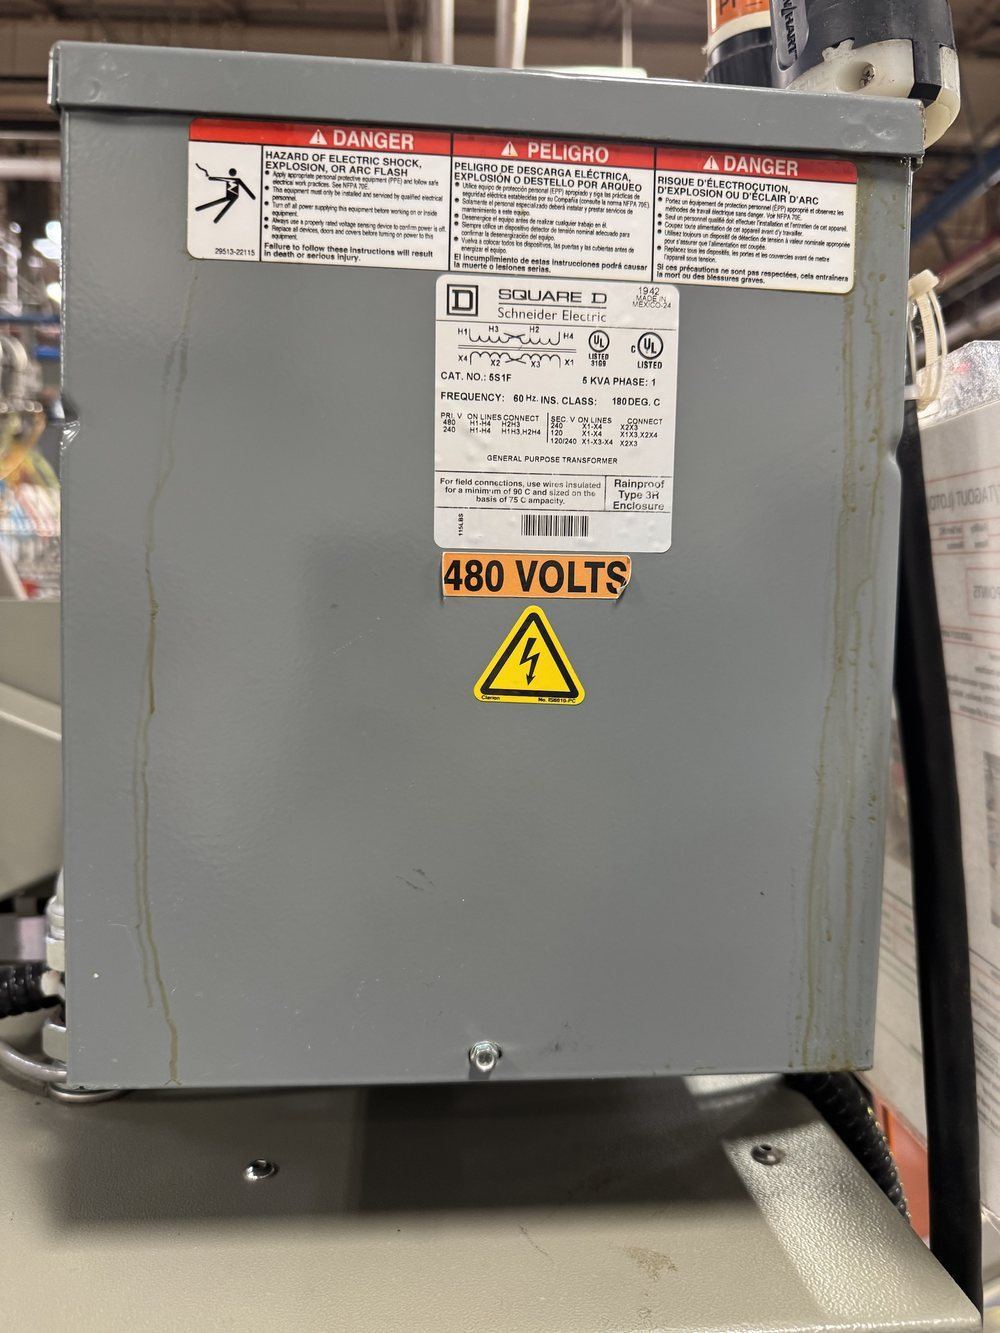
Square D (Schneider Electric) 5S1F, general purpose
RATING
5 kVA, single phase, 60 Hz, 180 °C insulation class
PRIMARY
480 V (H1-H4), connected phase-to-phase on the 480 V ungrounded delta
SECONDARY
120 / 240 V
ENCLOSURE
Type 3R rainproof
UNITS ON LINE 7
Four known; one showing resin weeping, three with no visible distress
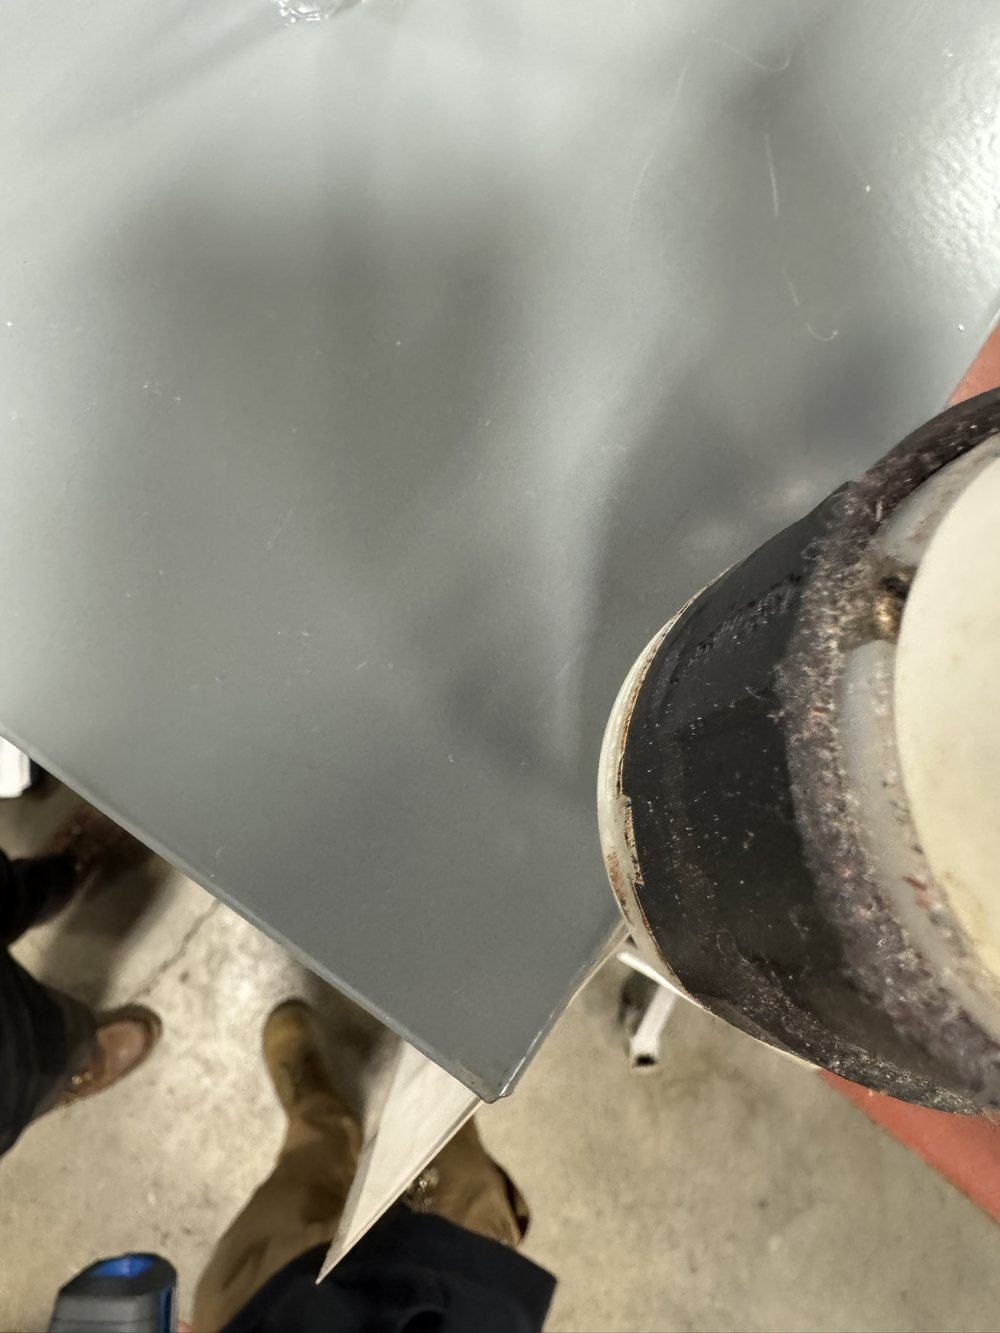
Line 7 transformer — enclosure and resin extrusionUNALTERED SITE PHOTOGRAPHS
Figure 2. Left: nameplate and enclosure, with resin runs down both sides. Right: resin extruded at the base. The enclosure top is clean, so the material originates inside the unit rather than dripping from above.
WHY THE RESIN MATTERS
Encapsulating resin does not flow at normal operating temperature. Extrusion from the enclosure indicates sustained overheating well beyond rated rise, with probable degradation of winding insulation. Symmetric runs on both sides point to bulk heating of the unit rather than a single localized fault.
04Line 7 machine control cabinet
Where the blown fuse sits, and where the transformer is mounted relative to it.
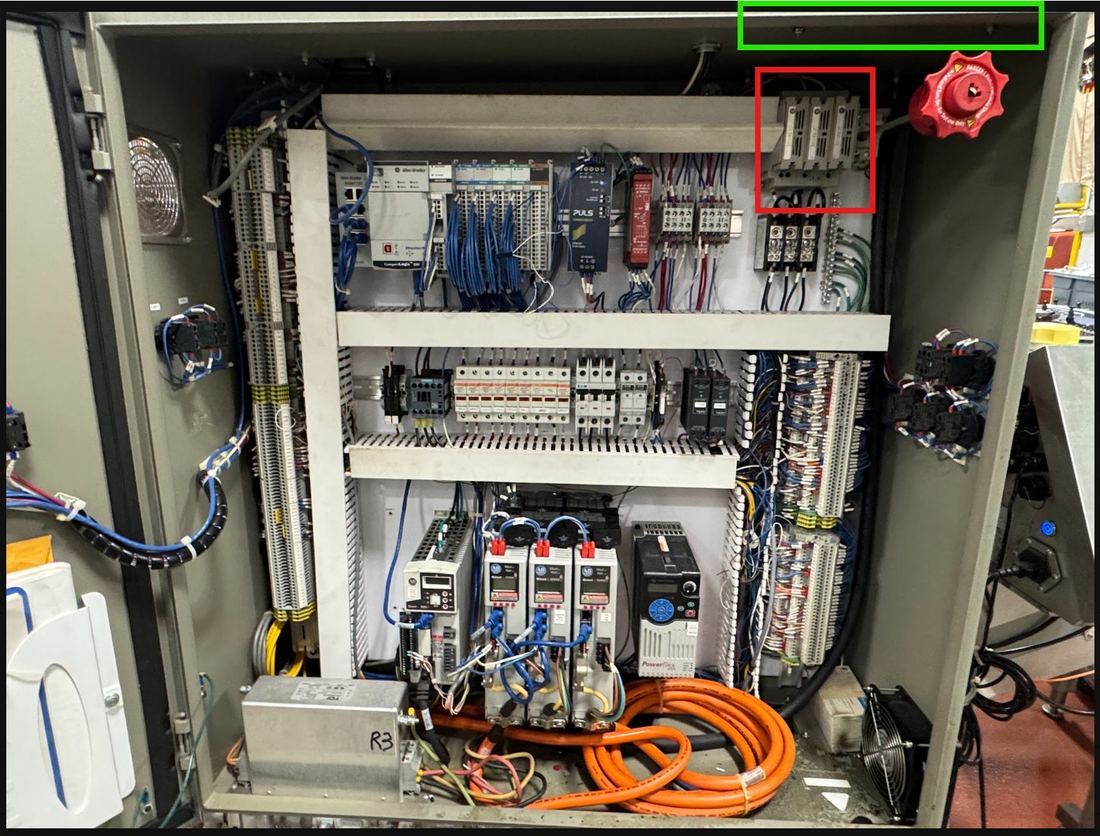
Control cabinet — blown fuse and transformer positionUNALTERED SITE PHOTOGRAPH
Figure 3. Red: location of the blown fuse. Green: position of the 5 kVA transformer, mounted above the machine (out of frame).
05Working theory
Tap a marked part of the diagram to see what it does in this theory.
Tap a highlighted part of the diagram — the surge protectors, a machine, the blown fuse or the transformer.
Each transformer is a single-phase unit connected phase-to-phase across the 480 V ungrounded delta. A winding connected this way presents series inductance between the two phases it bridges. To a fast transient — such as those produced by utility capacitor switching — that inductance acts as a choke, impeding transient current between those two phases, while the third phase, with no winding attached, is unimpeded. The result is an uneven distribution of transient energy across the three phases of the Line 7 bus.
This would account for each observed symptom
Only Line 7 affectedLine 7 is the bus carrying this transformer group; other lines lack the same configuration
Both bus SPDs failedThe SPDs sit on the bus duct upstream of the machines; uneven transient energy reflected back onto the bus is absorbed repeatedly until thermal disconnect
Fuse blown on the phase with no windingThe transformer bridges two phases; the blown fuse is on the third. That is the phase the hypothesis predicts carries the unimpeded transient
Transformer resin weepingThe distressed unit is directly downstream of the blown fuse; a degraded winding responds abnormally to transient stress, compounding the effect
No recurrence since fuse replacementConsistent with a discrete event aggravated by a degrading component, rather than a continuous supply condition
Supply clean at the mainThe mechanism is local to the Line 7 bus and is not visible at the utility main
STATUS
This is a working hypothesis based on field observation and the physical condition of the equipment. It is to be confirmed by the testing below before any conclusion is drawn or corrective hardware is specified.
06Next steps
Filter by who owns each item.
1
Logging session 1 — extended. Fluke 1775 on the Line 7 bus duct over a period with the line in normal production.
Captures transients and events local to Line 7 that are not visible at the utility main
DarkHawk
2
Logging session 2 — controlled. Short session with the engineer on site watching the 1775 live, and operators starting, stopping and cycling machines at the engineer's direction.
Attributes each recorded event to a specific machine or transformer operation
DarkHawk / Ops
3
Thermal scan all four transformers during session 2, with Line 7 running under load.
Confirms whether the weeping unit runs hot relative to the other three
DarkHawk
4
If thermal warrants: de-energize and megger the unit (primary-ground, secondary-ground, primary-secondary).
Confirms or rules out winding insulation breakdown
DarkHawk
5
Confirm which two phases each of the four transformers is connected across.
Establishes the per-phase inductive loading on the Line 7 bus
Maintenance
6
Confirm secondary connection (120, 240 or 120/240) and actual load on each unit.
Miswired secondary taps and overloading are common causes of overheating
Maintenance
7
Retain the blown fuse and both failed SPDs.
Physical evidence for teardown and warranty
Maintenance
00Report identification
480 V service entrance — engineering report.
SITE
The Jel Sert Company, 501 Conde St, West Chicago, IL 60185
SYSTEM
480 V, 3-phase, 3-wire, ungrounded delta
INSTRUMENT
Fluke 1775 three-phase power quality analyzer
MEASUREMENT POINT
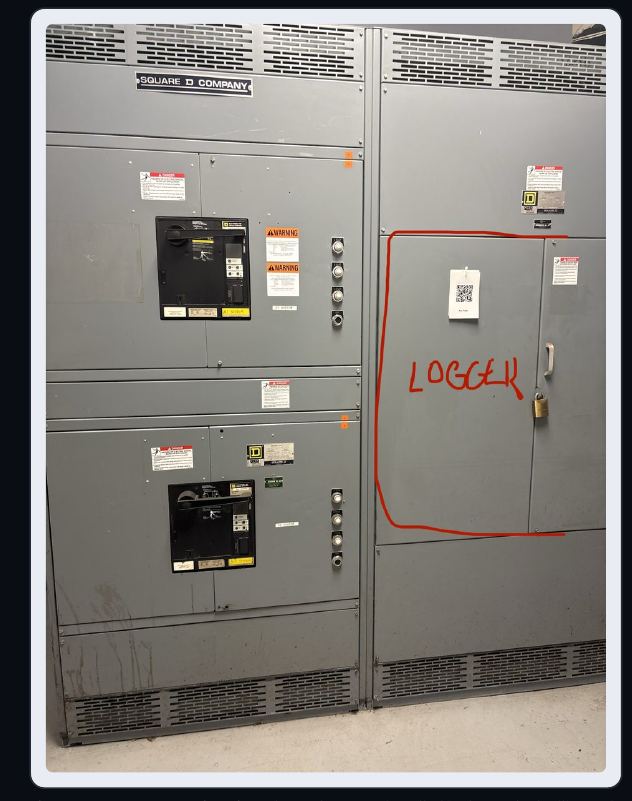
Utility CT / metering section of Switchboard A, ahead of the A1 and A2 system mains — upstream of all Gear A distribution
SERVING UTILITY
ComEd — 12,470 V primary, 2000 kVA transformer, Z 6.50%
Line 7 only. Rennco 1 and 3 surge protective devices (Mersen STXR480D05); one historical L1 fuse failure in the same MCC bucket
PREPARED BY
Luke Zarakas, Principal Energy Consultant, DarkHawk Industrial Energy
CLIENT CONTACTS
Simon Richards (VP Mfg & Eng); Victor Reyes (Maint. Supv.); Chris Borowiec
REPORT STATUS
Findings report — open items listed in Section 11
PRESENTING COMPLAINT
Recurring input fuse failures on variable frequency drives, breaker trips on unrelated equipment, and failure of newly installed surge protective devices on Line 7. The failures were attributed by site personnel to energization of a utility capacitor bank.
PRINCIPAL CONCLUSION
The capacitor-switching hypothesis is not supported as the ONLY source of the issues experienced. Though it is a proven contributor, the data shows there are internal issues that require deeper investigation to appropriately identify. Measured switching transients during this session were lower than previously recorded transients in this area and reach 1.06 per unit against an industry concern threshold of 2.0 per unit.
Across 519,161 data points captured, the service experienced one voltage sag below 90% of nominal. No ground fault was present at any time. The Line 7 SPD failures are localized to two of three machines sharing one bus and are inconsistent with any disturbance arriving from the utility.
Evidence basis
519,161 one-second records across 322 parameters, continuous from 7 to 13 August 2026.
A controlled utility switching test on 10 August, corresponding to the field record to the minute.
Waveform captures on an independent sub-millisecond trigger — events 1835, 2252 and 2256 reproduced here as unaltered instrument records.
NOAA NCEI severe weather and precipitation data for the session window.
e-Hazard distribution drawings (arc flash study, 19 August 2025) and site correspondence.
01Executive summary
Monitoring at one-second resolution with simultaneous voltage, current, power and harmonic capture, supplemented by waveform records, a controlled switching test, severe weather data and site correspondence.
519,161Records analyzed
23Disturbance seconds · 22 shallower than 8%
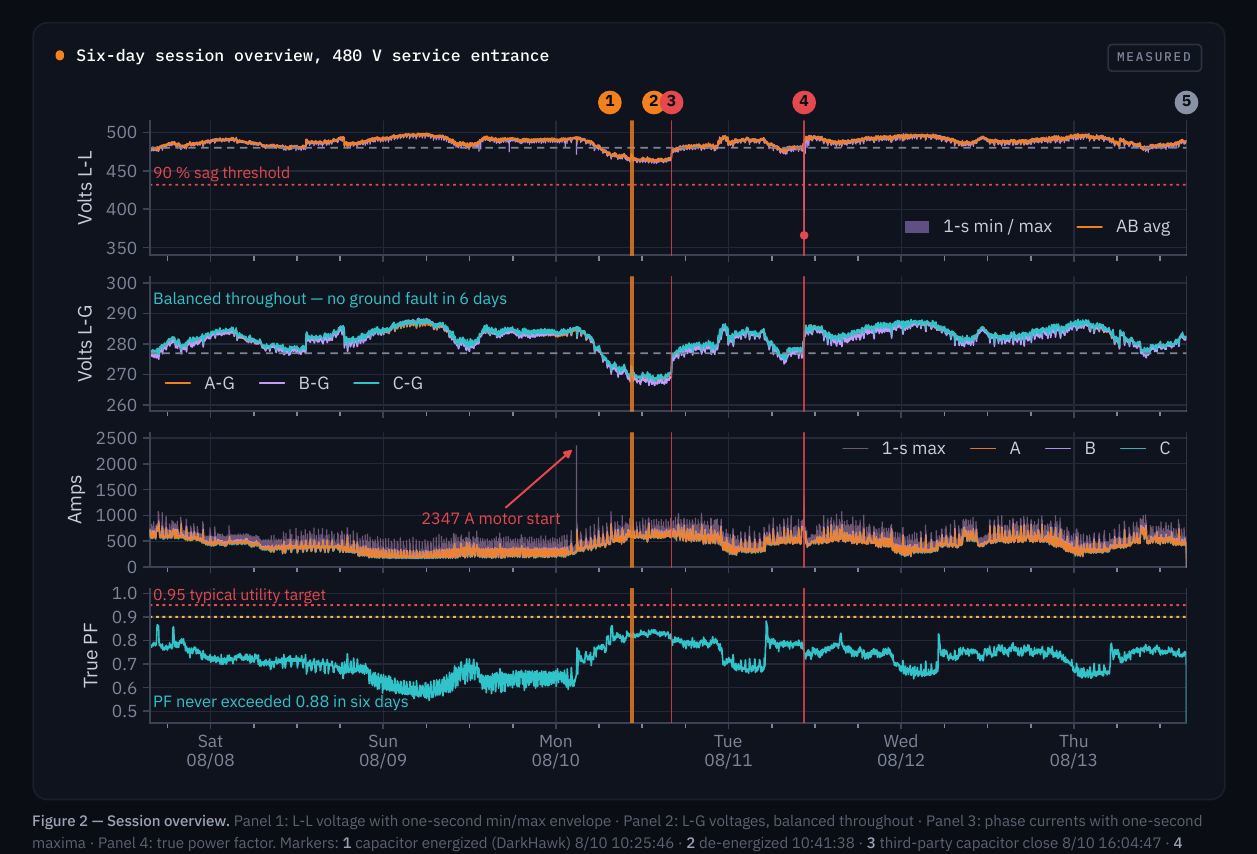
1Sag below 90% · 73.2% of nominal
0IEC 61000-4-30 flags
DETAILTwenty-three disturbance seconds identified in 519,161 records. Twenty-two were shallower than 8% deviation. One sag reached 73.2% of nominal. Zero intervals were flagged under IEC 61000-4-30 criteria.
DETAILEstablished through prior monitoring at multiple locations on this feeder and substation, where recorded magnitudes exceeded those captured during this session. No utility remedy exists and none is obligated under any governing standard. All mitigation is customer-side — see Section 5.4.
DETAILLine-to-ground voltages remained balanced between 255 V and 289 V for the entire session, with zero-sequence voltage effectively nil.
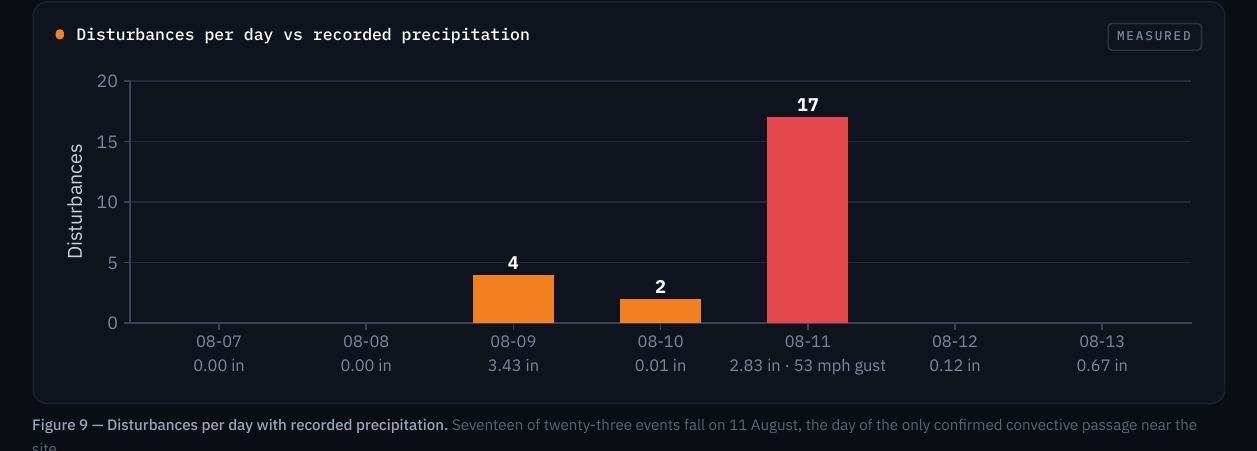
DETAILSeventeen of twenty-three events occurred on 11 August during a confirmed convective passage. Two complete R2-R30 recloser sequences were identified from the customer meter alone.
DETAILOnly Line 7 is affected out of the entire facility. Two of three identical devices on one bus failed while the third remained functional. Both the surge protective devices and the single historical fuse failure share one physical location.
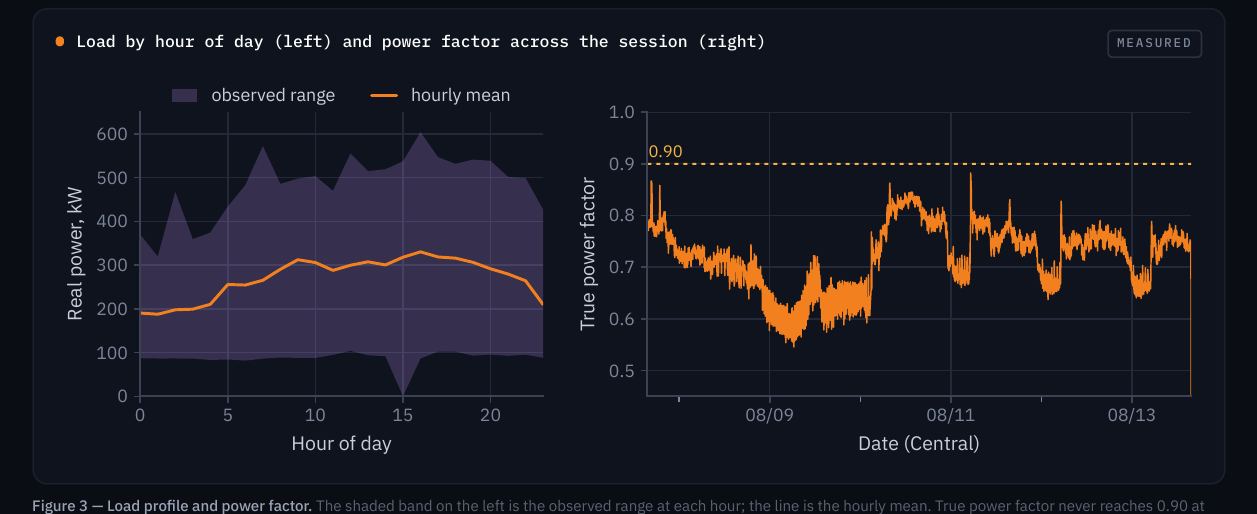
DETAILMean 0.72, range 0.55 to 0.88, below 0.90 for 100% of measured minutes. Assessed on electrical grounds only — see Section 4.
OUTSTANDING DETERMINANT
One question governs the Line 7 root cause and remains unanswered: are the surge protective devices landed on the line side or the load side of the MCC bucket fuses? This determines whether a device failing in a shorted condition would open its own bucket fuse — which would account for both failure types at one location. It is an inspection, not an analysis.
A Fluke 1775 analyzer was installed in the utility CT and metering section of Switchboard A, ahead of the A1 and A2 system mains. 322 parameters at one-second aggregation, retaining minimum, mean and maximum sub-interval values. Waveform capture ran concurrently on a separate trigger with sub-millisecond resolution.
Figure 1 — Measurement location. The analyzer was installed in the marked utility CT / metering section, immediately adjacent to the A1 SYSTEM and A2 SYSTEM mains. All Gear A distribution, including Line 7, is downstream of this point.
WHY THIS LOCATION MATTERS
The analyzer sits ahead of every panel, feeder and machine on Gear A. Anything arriving from the utility was captured, so conclusions about external causes are strong. Anything generated inside the facility downstream of the switchgear was not captured, so the absence of a recorded disturbance does not exclude an internal cause — it points to one.
ANALYZER
Fluke 1775
AGGREGATION
1 s
PARAMETERS
322
SUB-INTERVAL
min / mean / max
WAVEFORM TRIGGER
sub-millisecond
RECORDS
519,161
2.3 Analytical method
METHODDetection used the within-second excursion (interval mean minus interval minimum) rather than a fixed RMS threshold. This identifies sub-cycle events that a threshold test on interval means would not register. Detection floor was 8 V of excursion.
METHODVoltage was regressed against real power on 20-minute windows either side of each candidate step, and the two fits compared at common load. This separates genuine source-side changes from load-driven droop.
METHODEvents were cross-referenced against NOAA NCEI severe weather data, precipitation records, documented utility switching operations, and site correspondence.
03Session overview
Six days at the 480 V service entrance.
Six-day session overview, 480 V service entranceMEASURED
Figure 2 — Session overview. Panel 1: L-L voltage with one-second min/max envelope · Panel 2: L-G voltages, balanced throughout · Panel 3: phase currents with one-second maxima · Panel 4: true power factor. Markers: 1 capacitor energized (DarkHawk) 8/10 10:25:46 · 2 de-energized 10:41:38 · 3 third-party capacitor close 8/10 16:04:47 · 4 73.2% sag 8/11 10:30:09 · 5 logger removed 8/13 15:39. Tap to enlarge.
Parameter
Minimum
Mean
Maximum
Assessment
Voltage L-L
445.7 V
487.2 V
500.4 V
Within ±5% except during faults
Voltage L-G
255 V
281 V
289 V
Balanced; no ground fault
Phase current
~150 A
~520 A
2347 A
Peak is a motor start, not a fault
Real power
88 kW
~340 kW
~600 kW
Service lightly loaded
True power factor
0.55
0.72
0.88
Poor — never above 0.90
Voltage THD
1.4%
1.7%
2.4%
Low
Current THD
2.7%
4.2%
5.1%
Low
K-factor
1.04
1.09
1.12
Essentially linear aggregate load
Voltage unbalance
0.14%
0.25%
0.47%
Excellent
Frequency
59.96 Hz
60.00 Hz
60.05 Hz
Normal
Table 1 — Session parameter summary.
READ THESE FIGURES AT THE MAIN, NOT AT A PANEL
K-factor 1.09 and current THD near 4% reflect aggregate load at the utility main, where drive harmonics are diluted by whole-facility linear load. Distortion local to an individual drive panel would be substantially higher. These figures must not be used to assess any downstream panel.
04Power factor
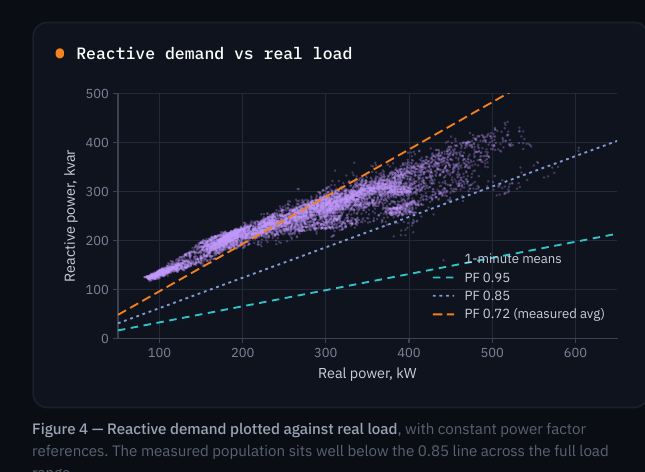
True and displacement power factor track closely, confirming fundamental reactive demand rather than harmonic distortion. Reactive power runs 200–400 kvar against 140–600 kW real load.
Load by hour of day (left) and power factor across the session (right)MEASURED
Figure 3 — Load profile and power factor. The shaded band on the left is the observed range at each hour; the line is the hourly mean. True power factor never reaches 0.90 at any point in the six-day record.
Figure 4 — Reactive demand against real load, with constant power factor references. The measured population sits well below the 0.85 line across the full load range.
BASIS OF ASSESSMENT
This utility bills on peak demand rather than power factor, so no billing penalty arises from the measured value and none is claimed here. Power factor is assessed on electrical grounds only: elevated reactive current increases conductor and transformer heating for the same useful output, consumes capacity in the service and feeders, and increases voltage drop under load. A billing structure which does not price reactive demand is consistent with heavier reliance on utility-side capacitor banks for voltage support, which is relevant to Section 5.4.
CAUTION ON CORRECTION
Any power factor correction installed at 480 V on this system must incorporate series detuning reactors. Undetuned capacitance at the low-voltage bus is the specific mechanism by which the utility switching transients documented in Section 5.4 would be amplified further.
05Capacitor switching analysis
5.1 Controlled test, 10 August 2026
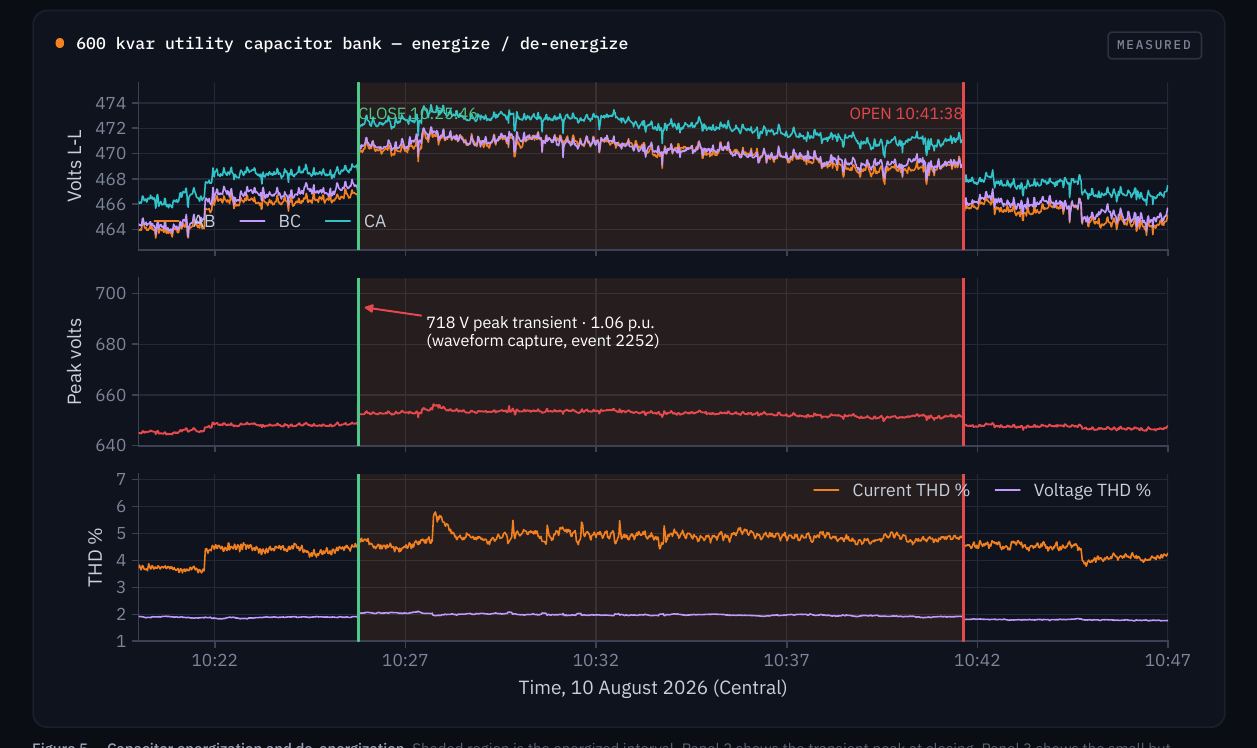
A controlled test was performed with monitoring in place. A failed capacitor cell was found and re-fused. All three cells (600 kvar total) were gang-closed, held for approximately 16 minutes, then opened. The recorded data corresponds to this sequence to the minute, providing independent verification of both the instrument clock and the switching times.
600 kvar utility capacitor bank — energize / de-energizeMEASURED
Figure 5 — Capacitor energization and de-energization. Shaded region is the energized interval. Panel 2 shows the transient peak at closing. Panel 3 shows the small but repeatable distortion shift while the bank was in service.
JELSERT · Event ID 2252 · 10 August 2026, capacitor energizationUNALTERED INSTRUMENT RECORD
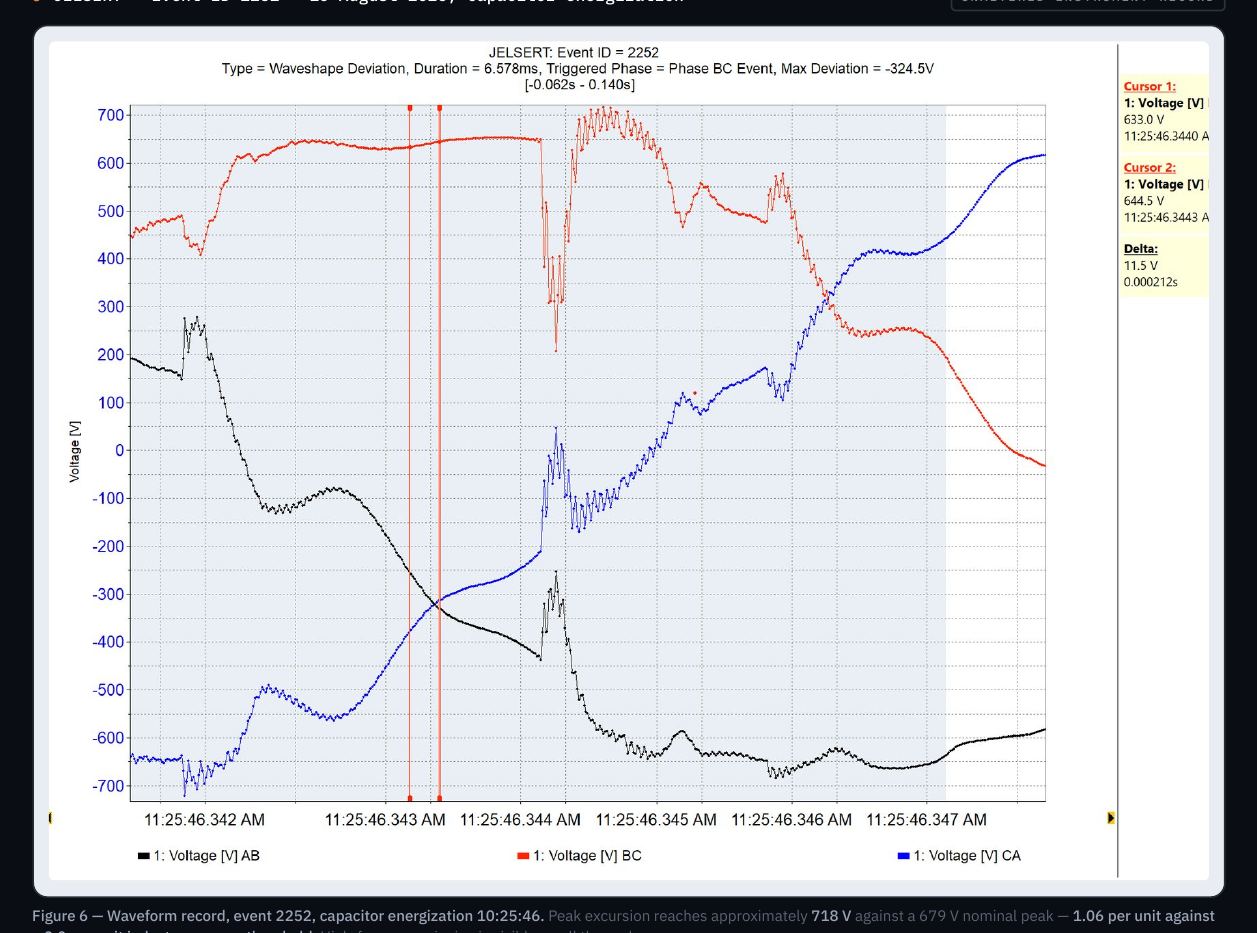
Figure 6 — Waveform record, event 2252, capacitor energization 10:25:46. Peak excursion reaches approximately 718 V against a 679 V nominal peak — 1.06 per unit against a 2.0 per unit industry concern threshold. High-frequency ringing is visible on all three phases.
WHY 1.06 P.U. MATTERS LESS THAN IT SOUNDS
Classification is a waveshape deviation of 324.5 V over 6.578 ms — a multi-cycle ring rather than an impulse. Magnitude sits well below the level at which industry guidance raises concern. The significance of capacitor switching at this site is cumulative duty, addressed in Section 5.4, not the magnitude of any single operation.
Instrument trend view · 10 August 2026 · 600 kvar bankUNALTERED INSTRUMENT RECORD
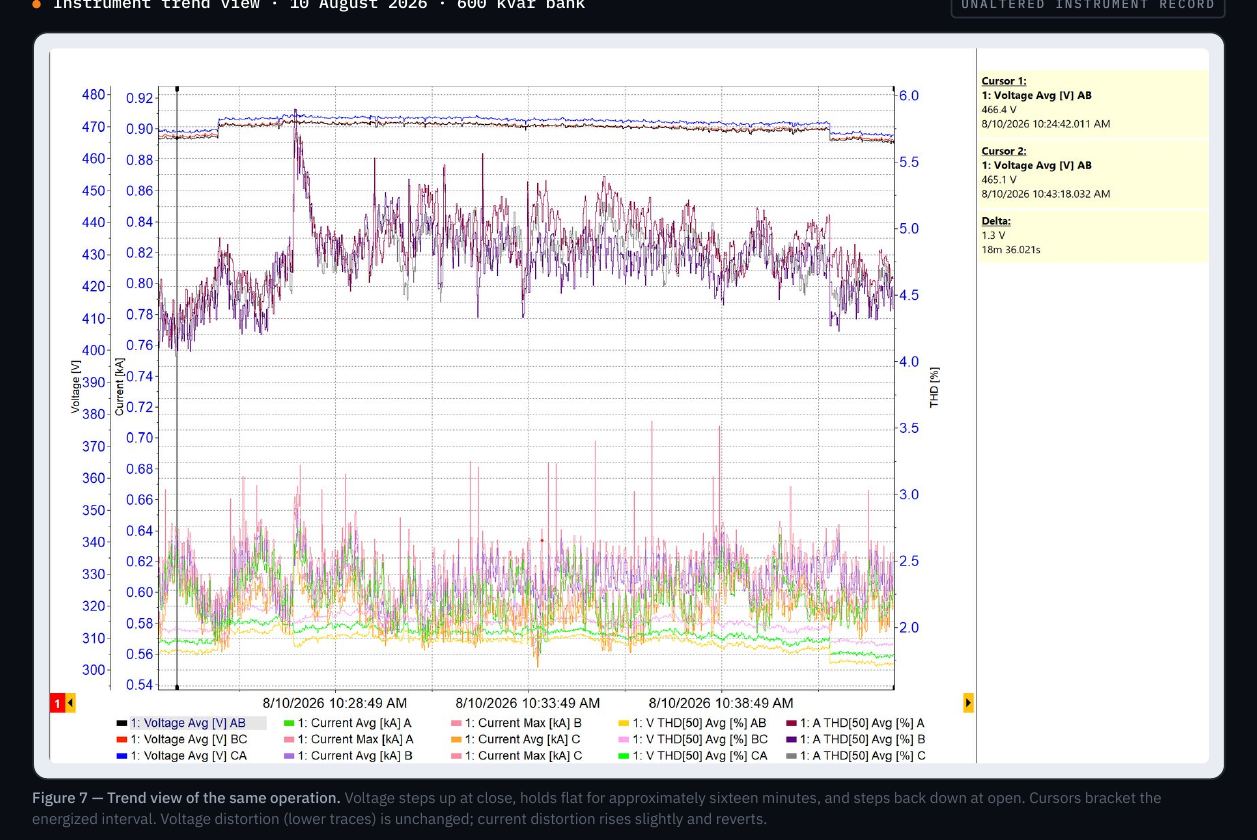
Figure 7 — Trend view of the same operation. Voltage steps up at close, holds flat for approximately sixteen minutes, and steps back down at open. Cursors bracket the energized interval. Voltage distortion is unchanged; current distortion rises slightly and reverts.
INDEPENDENT CLOCK VERIFICATION
The one-second trend export registers the step at 10:25:46 and its return at 10:41:38 — the same times recorded in the field during the controlled switching. The recorded data corresponds to the switching sequence to the minute, independently verifying both the instrument clock and the switching times.
5.2 Back-to-back switching
The station capacitors were already energized at the time of the test. The gang-close therefore constituted back-to-back switching, and no inrush reactors are installed. IEEE 141 §8.12.2.3 addresses this case directly: transient voltages are comparable to single-bank switching, but because the banks are electrically adjacent the inrush currents may be substantially higher, limited only by bus, switch and instrument transformer inductance typically in the range of 100 to 200 microhenries.
5.3 Third-party switching event, 16:04:47
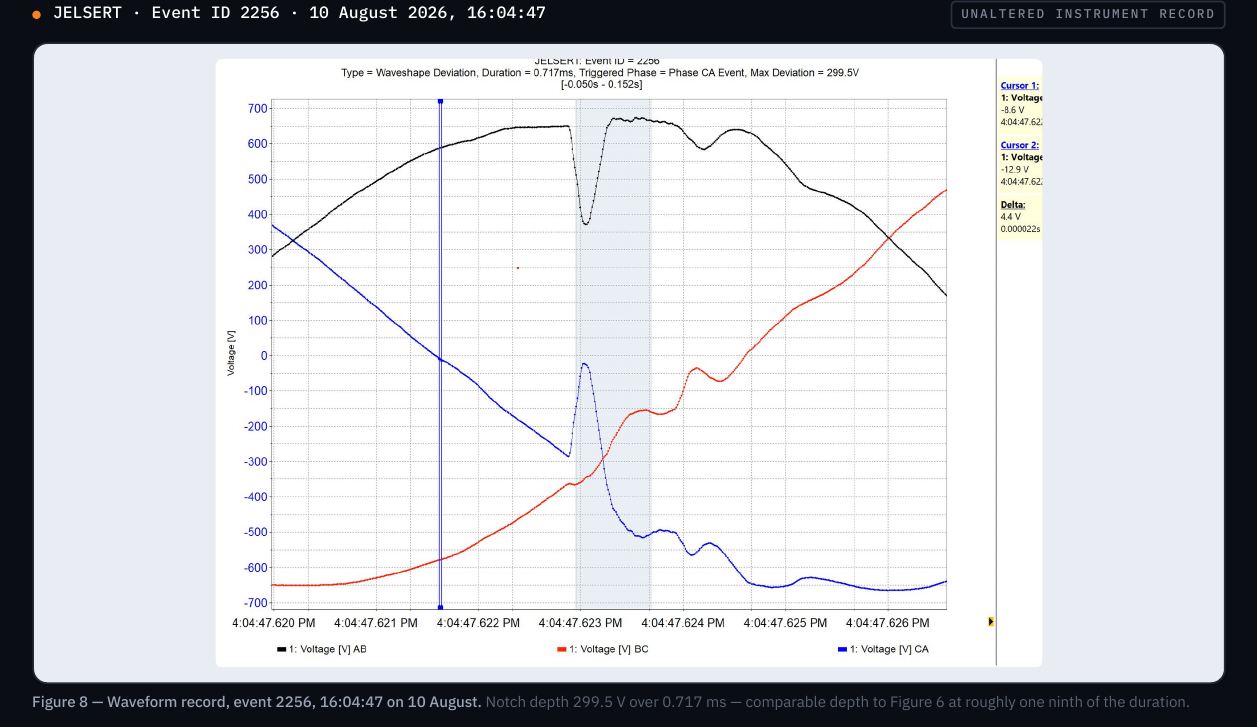
The bank was left open on departure. At 16:04:47 the same day a second switching operation occurred that was not performed by DarkHawk. Waveform record 2256 classifies it as a waveshape deviation of 299.5 V over 0.717 ms, triggered on phase C-A. The associated steady-state step was approximately +8 V, roughly three times the magnitude of the 600 kvar operation. The significant characteristic is rate of change rather than magnitude: a comparable notch depth occurring in approximately one ninth of the time represents an appreciably steeper dv/dt, which is the parameter governing stress on metal-oxide varistors and rectifier semiconductor junctions. Overshoot nevertheless remained near 1.03 per unit.
299.5VNotch depth · vs 324.5 V at 10:25:46
0.717msNotch duration · ≈1/9 of the 6.578 ms ring
~8VSteady-state step · ≈3× the 600 kvar operation
1.03p.u.Overshoot · triggered on C-A
JELSERT · Event ID 2256 · 10 August 2026, 16:04:47UNALTERED INSTRUMENT RECORD
Figure 8 — Waveform record, event 2256, 16:04:47 on 10 August. Notch depth 299.5 V over 0.717 ms — comparable depth to Figure 6 at roughly one ninth of the duration.
5.4 A recurring contributor
The controlled test characterizes one bank under one operation and does not characterize the exposure. Several capacitor banks operate on this feeder, switching on schedules outside the customer's knowledge or control. Their aggregate effect is a repeated transient duty on every piece of connected equipment in the building.
WHAT IT DOES EXPLAIN
This accounts for cumulative transient stress on connected equipment across the facility, and is a significant factor in the service life of surge protective devices, drive front ends and MOV-based protection. It should be treated as a permanent condition of this service.
WHAT IT DOES NOT EXPLAIN
It does not, on its own, account for the Line 7 failures. A capacitor transient reaches every panel in the building through the same bus; it cannot select one line out of several, nor two of three identical devices on one bucket. A local factor is also present — see Section 8.
PRACTICAL CONSEQUENCEThere is no utility remedy. The utility is not obligated under any governing standard to limit capacitor switching transients, and will not modify its operation. Every available mitigation is on the customer side of the meter. Recommendations in Section 9 proceed on that basis.
Exposure characteristic
Evidence in this session
Consequence
Multiple banks on the feeder
Station capacitors already energized before the controlled test; a third-party operation followed the same day at 16:04:47
Switching duty is not under customer control
Back-to-back configuration
No inrush reactors installed; IEEE 141 §8.12.2.3 conditions apply
Inrush current may be substantially higher
Steeper dv/dt on third-party operation
0.717 ms notch vs 6.578 ms for the 600 kvar bank
Greater stress on MOVs and rectifier junctions
Historically larger magnitudes on this feeder
Prior DarkHawk monitoring at other points recorded transients exceeding this session's 1.06 p.u.
This session is a mild sample, not a worst case
Table 3 — Characteristics of the ongoing capacitor exposure.
06Disturbance inventory
Twenty-three seconds exhibited a within-second excursion exceeding 8 V. Depth is the lowest line-to-line one-second minimum as a percentage of 480 V nominal. Filter or sort the table.
Timestamp
AB min
BC min
CA min
% nom
Low
Peak A
Attribution
Table 4 — Complete disturbance inventory. Every row reproduces exactly from the 519,161-row instrument export; "Peak A" is the maximum phase-A current in the same one-second interval.
6.1 Distribution and severity
Disturbances per day vs recorded precipitationMEASURED
Figure 9 — Disturbances per day with recorded precipitation. Seventeen of twenty-three events fall on 11 August, the day of the only confirmed convective passage near the site.
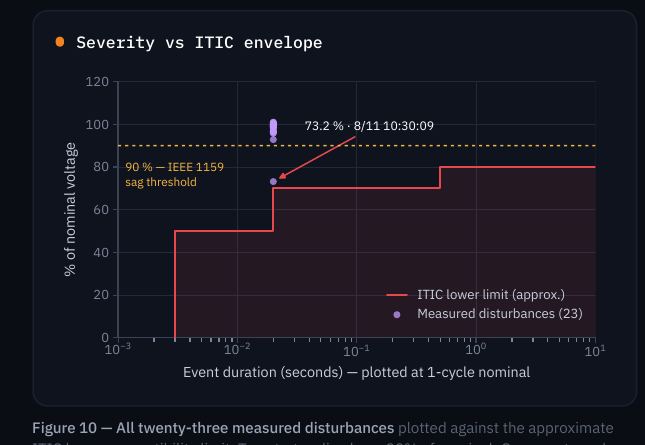
Figure 10 — All twenty-three measured disturbances plotted against the approximate ITIC lower susceptibility limit. Twenty-two lie above 90% of nominal. One event reaches 73.2%.
WHAT THE SEVERITY DISTRIBUTION MEANS
Only one disturbance falls into the range where drive undervoltage protection typically operates. Published guidance places most PWM drive undervoltage trip points between 70% and 85% of nominal DC bus voltage, placing the 11 August event at the margin. The remaining twenty-two are shallow enough that correctly configured equipment should ride through them without response. The customer reports no equipment response to the 11 August event.
22Above 90% nominal · of 23 events
1In drive-trip range · 73.2%, at the margin
6.2 Largest current excursion
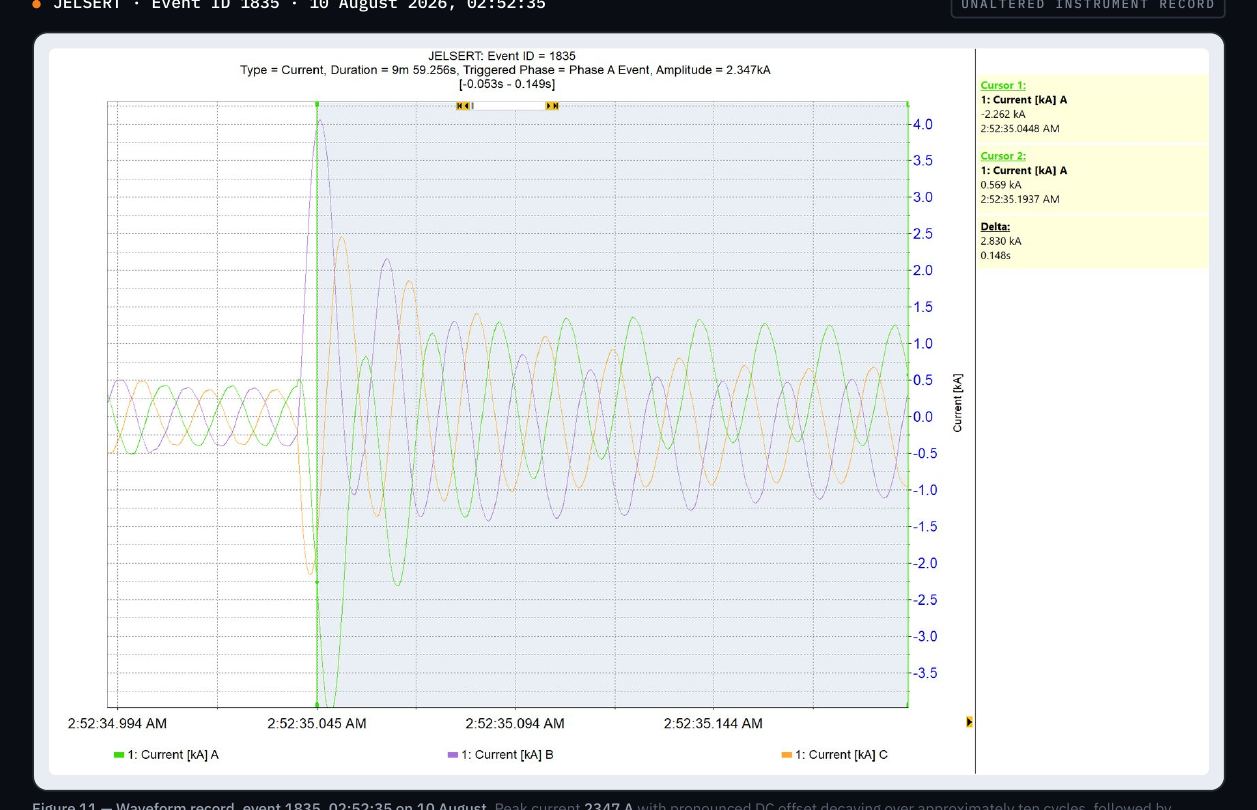
JELSERT · Event ID 1835 · 10 August 2026, 02:52:35UNALTERED INSTRUMENT RECORD
Figure 11 — Waveform record, event 1835, 02:52:35 on 10 August. Peak current 2347 A with pronounced DC offset decaying over approximately ten cycles, followed by sustained elevated load. This is a large motor or line start — a normal facility operation, and the largest current excursion in the session.
WHY THIS IS LOAD, NOT FAULT
A decaying DC offset over roughly ten cycles followed by a sustained elevated current is the signature of magnetizing inrush into a motor or line start. A fault does not settle into a higher steady load; it clears. The associated voltage excursion — 471.6 / 474.3 / 475.9 V, 98.2% of nominal — is a normal starting droop, and it appears in Table 4 attributed to load rather than to the utility.
07Storm fault sequence and recloser confirmation
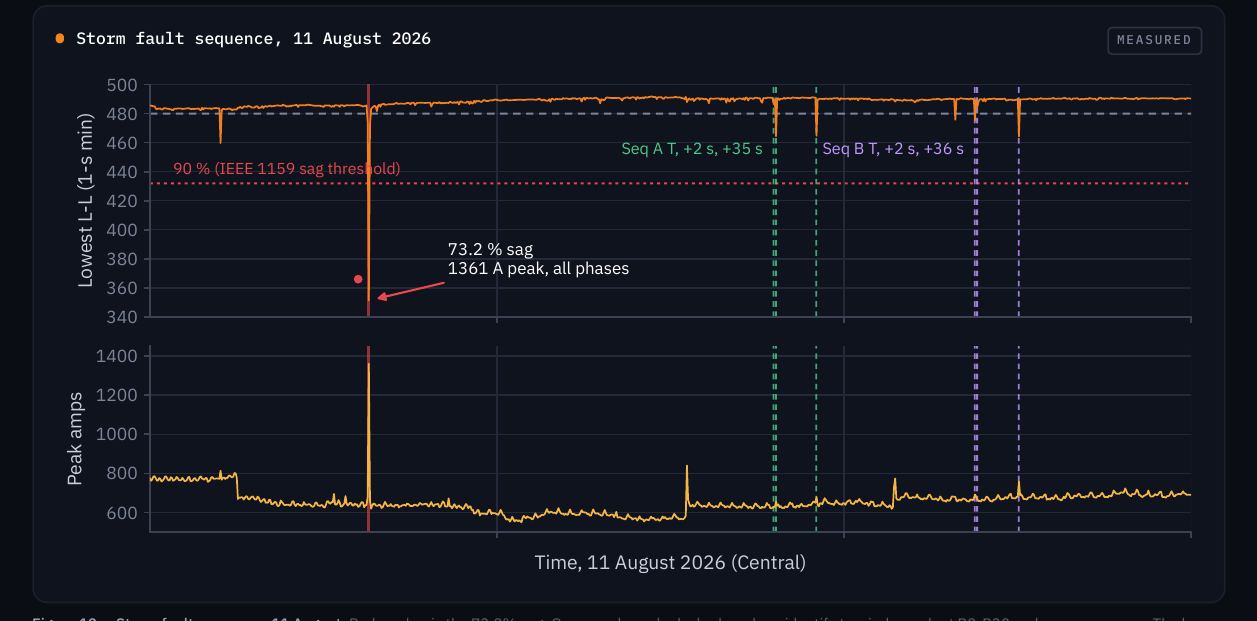
NOAA severe weather records storm cell detections near the site at 10:32:50 and 10:36:03 on 11 August. The site recorded 2.83 inches of precipitation that day with gusts to 53 mph. The electrical disturbance cluster spans 10:28 to 11:10, bracketing the detections.
Storm fault sequence, 11 August 2026MEASURED
Figure 12 — Storm fault sequence, 11 August. Red marker is the 73.2% sag. Green and purple dashed markers identify two independent R2-R30 recloser sequences. The lower panel is the peak across all three phases, reaching 1361 A at the sag; Table 4 lists the phase-A value for the same second, 1247 A.
7.1 Recloser sequence identification
R2-R30 reclosing on this feeder: initial trip, first reclose ~2 s, second reclose ~30 s. The plant did not lose supply, so the faults were on adjacent circuits sharing the substation bus — observed here as a sag at each fault-on interval. Two sequences are identifiable:
Sequence
Shot 1
Shot 2
Interval 1
Shot 3
Interval 2
A
10:35:59
10:36:01
2.0 s
10:36:36
35.0 s
B
10:38:53
10:38:55
2.0 s
10:39:31
36.0 s
Table 5 — Identified R2-R30 recloser sequences.
CONFIRMING EVIDENCE
The two deep shots of sequence A measure 481.4 / 464.4 / 472.9 V and 481.7 / 464.7 / 473.0 V respectively — agreement within 0.3 V on all three phases, thirty-five seconds apart. Reproducing a sag to that precision requires re-energizing the same fault at the same location. This constitutes confirmation of the reclosing scheme from customer-side measurement alone, without utility records.
7.2 Fault location inference
Twelve of the seventeen events on 11 August, including the deep sag, exhibit the B-C phase pair as the lowest voltage. Repeated faults on a single phase pair through a convective passage indicate one recurring fault location — typically vegetation contact or a tracking insulator.
08Line 7 surge protective device failures
8.1 Scope of the failures
Question
Response (site personnel)
Significance
Is Line 7 the only line affected?
Yes, as far as known
Excludes any bus-wide or utility-side cause; those reach every line simultaneously
Which gear feeds Rennco 1, 2, 3?
Gear A
Downstream of the measurement point; monitored
How are the SPDs connected?
Tied in at the bucket, on the bus
Places the devices at the MCC bucket, not at a panel or service entrance
SPD model installed
Mersen STXR480D05
Delta variant — correct for ungrounded 480 V (§8.3)
Historical fuse failures
First time; blew L1 fuse in the bucket
One event, one phase, same location as the SPDs
Anything trip on 11 Aug ~10:30?
Not aware of anything
The only significant sag recorded produced no consequence
Table 6 — Scope of the reported failures.
THE COMMON DENOMINATOR
Both failure types share one physical location. The surge protective devices are landed at the Rennco MCC bucket. The single historical fuse failure was an L1 fuse in the bucket. One line out of the facility, one location within that line.
8.2 Reported timing
Source
Reported timing
Character
2nd shift mechanic lead (via V. Reyes)
Friday ~20:00 (7 Aug)
Direct observation
S. Richards email, 10 Aug
"this morning" (Mon 10 Aug)
Relayed
Customer text message
"Monday morning"
Relayed
V. Reyes, 10 Aug
"I don't know what time it happened"
Explicit uncertainty
Table 7 — Reported failure timing, as received.
DEVICES WERE ENERGIZED WHEN OBSERVED DARK
The status LEDs on the Rennco 1 and Rennco 3 devices were observed extinguished while those machines were running. The devices were therefore energized at the time of observation.
Two consequences. It eliminates loss of supply as an explanation — per manufacturer literature the LED extinguishes only when the thermally protected MOV assembly has disconnected at end of life, so these units require replacement, not reset. And it sets a firm upper bound on the failure time: already failed by approximately 20:00 on Friday 7 August, with production running. Line 7 then ran until approximately 06:50 the following morning with two of three machines unprotected. No fuse failure, breaker operation or damage was reported. Site inspection found bus bar fuses intact and the fuses, breaker and drives inside Rennco 1 and 3 serviceable.
NEITHER CANDIDATE FAILURE DATE CONTAINS A DISTURBANCE
Friday 7 August 15:31 to Saturday 07:00: line-to-line 475.3–495.1 V, no flagged interval. Monday 10 August 00:00–12:00: no second below 455 V. No measurable precipitation and no storm cell detection on either day.
8.3 Device suitability
The installed devices are confirmed by the customer as Mersen Surge-Trap STXR480D05 — the delta variant of the series. Manufacturer data lists this series as rated for 480 V three-phase delta and high-resistance-grounded wye systems, with maximum continuous operating voltage of 550 V line-to-ground and 1100 V line-to-line. IEEE 141 §6.5.1 and industry practice require MCOV at line-to-line voltage on ungrounded systems, because a single ground fault imposes full line-to-line voltage on the unfaulted phases for an indefinite period.
CORRECTLY SPECIFIED
The devices are correctly specified for this system. An early hypothesis of misapplication is not supported and is formally withdrawn. The series also includes a wye variant (STXR480Y05A) rated 640 V MCOV, which would be marginal here; the part number confirms the correct variant was installed.
BUT THEY CANNOT PROTECT THE DRIVES
The consequent voltage protection rating is 3000 V L-L and 1800 V L-G, against typical drive rectifier semiconductors rated 1200 V PIV. These devices cannot protect drive front ends and never could. That is inherent to ungrounded operation, not a specification error.
550VMCOV line-to-ground · STXR480D05
1100VMCOV line-to-line · required ungrounded
3000VVPR line-to-line · 1800 V L-G
1200VDrive rectifier PIV · below the VPR, unprotected
8.4 Selective failure
DECISIVE OBSERVATION
Line 7 comprises three Rennco machines, each with its own surge protective device on the same 480 V bus. Devices on Rennco 1 and Rennco 3 failed. The device on Rennco 2 remained functional. A disturbance arriving from the utility reaches all three identically and cannot select two of three. The cause is therefore local to Rennco 1 and 3 or to their branch circuits.
The analyzer sat upstream of all facility distribution, so anything reaching Line 7 from outside passed through it first. Nothing did on either candidate date. An external origin is excluded; the cause lies downstream of the main switchgear.
8.5 Leading explanation
Reported: one L1 fuse, in the Rennco bucket, first occurrence. A metal-oxide varistor failing shorted draws fault current through the affected phase only. If landed on the load side of the bucket fuses, that failure opens exactly one fuse and disables the device in the same instant — one phase, one fuse, one dead device. IEEE 141 §6.6 notes arrester failure entails very low impedance with current approaching fault magnitude.
Observation
If landed load side of the fuse
If landed line side
MOV fails shorted
Fault current opens that phase's bucket fuse
Fault current bypasses that bucket fuse
One L1 fuse blown, first occurrence
Explained — same event, same instant
Requires a separate, unexplained cause
Device dark while energized
Explained — internal disconnect at end of life
Explained equally
Both failure types at one location
Explained by a single mechanism
Requires two independent mechanisms
Table 8 — Why the landing position is determinative.
STATED AS HYPOTHESIS, NOT FINDING
The manufacturer states the STXR requires no supplementary overcurrent protection because the thermally protected MOV assembly disconnects internally, so a correctly installed device should not operate an upstream fuse. Whether the devices are landed line side or load side of the bucket fuses is the single determination that confirms or refutes this, and it is listed first among the open items in Section 11.
09Conclusions and recommendations
9.1 Hypotheses evaluated against the measured record. Filter by status.
Capacitor switching — cumulative facility stress
CONFIRMED CONTRIBUTOR
Established across multiple historical sessions at different logging locations along the utility feeder; not remediable via utility; customer-side mitigation only (§5.4)
Capacitor switching — cause of Line 7 failures
EXCLUDED
Reaches all lines simultaneously; only Line 7 affected, and only 2 of 3 devices on one bucket
Voltage magnification via customer capacitance
NOT SUPPORTED
No LV capacitors identified; no magnification signature
Ground fault on the ungrounded system
EXCLUDED
L-G balanced 255–289 V for the full session
SPD misapplication on ungrounded system
WITHDRAWN
STXR480D05 confirmed; 550 V L-G / 1100 V L-L, correct
Lightning damage to Line 7 devices
WEAKENED
No convective cells on either candidate day
SPD failing shorted, opening its own bucket fuse
LEADING
Explains one phase, one fuse, one dead device, one location. Requires line/load side confirmation (§8.5)
Cause local to the Rennco MCC buckets
CONFIRMED LOCALIZATION
Only Line 7 affected facility-wide; Rennco 2 unaffected on the same bus
Deficient displacement power factor
CONFIRMED
Mean 0.72, below 0.90 in 100% of minutes; electrical impact only
Table 9 — Hypotheses evaluated against the measured record.
FRAMINGTwo problems, two different responses. The Line 7 failures are localized and should be resolved by inspection at the bucket — low cost, high certainty. The capacitor exposure is facility-wide and ongoing; it is a case for customer-side hardening on a planned basis rather than an emergency response.
9.2 Recommended actions
PRIORITY 1Determinative, no cost
Determine whether the surge protective devices are landed on the line side or the load side of the bucket fuses. This confirms or refutes the leading explanation in §8.5 and should be established before any replacement device is energized.
Photograph the device landing inside a bucket: connection point relative to the fuses, lead length as installed, and phase assignment. Lead inductance adds directly to let-through voltage; these units ship with 36-inch leads and any excess should be recorded.
Establish whether the L1 fuse failure and a device failure occurred in the same bucket at the same time, or as separate events.
Record the installation date from the label on each Line 7 surge protective device, and confirm whether the Rennco 2 device was continuously energized.
PRIORITY 2Further narrowing
The present data localizes the failures but does not identify the mechanism. The following close that gap and should be completed before hardware is specified.
Targeted monitoring at the Line 7 MCC bucket. Service-entrance monitoring cannot see events generated downstream. A logger at the bucket, or at the panel feeding it, captures switching, contactor operations and local faults invisible at the main.
Documented failure history from the customer. Dates, equipment, circuit and phase for every electrical failure across the facility — including breaker trips. This is the single largest body of untapped evidence and is requested as Item 8 in Section 11.
Insulation resistance and continuity testing at the Rennco buckets. Establishes whether a wiring or insulation condition exists that is local to the two affected machines.
Comparative inspection of Rennco 2 against 1 and 3. Physical, not documentary. Machine revision, control wiring, bucket construction, feeder routing.
Return the two failed devices for teardown. Sectioning distinguishes single-event failure from cumulative absorption, and identifies which mode operated.
PRIORITY 3Customer-side hardening
Addresses the permanent capacitor exposure in Section 5.4. No utility remedy is available.
Treat surge protective devices as consumables. Given the transient duty on this feeder, establish a periodic LED inspection route so a failed device is found in days, not incidentally.
Install 3% AC line reactors ahead of sensitive drives. Trade-off: reduces inrush and capacitor-switching sensitivity, does not prevent sag-induced tripping.
Review drive ride-through settings before purchasing hardware. Lowest-cost intervention.
If power factor correction is pursued, it must be detuned with series reactors. Undetuned low-voltage capacitance would amplify the transients in Section 5.4.
10Reference drawings and site views
Distribution drawings prepared by e-Hazard (arc flash study, 19 August 2025), reproduced to document the path between the measurement point and the affected equipment.
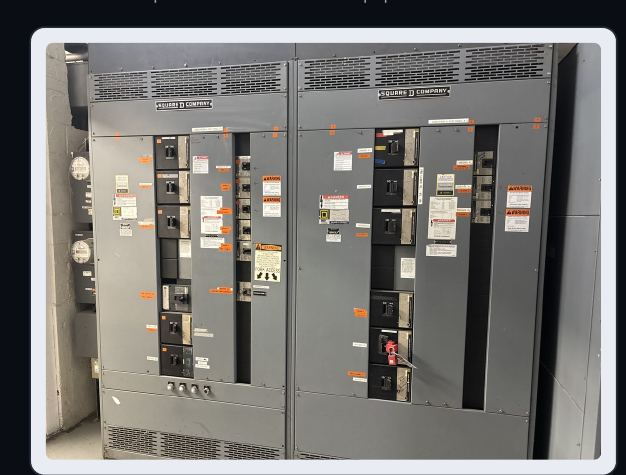
Figure 13 — Substation A distribution sections, showing feeder breaker identification.
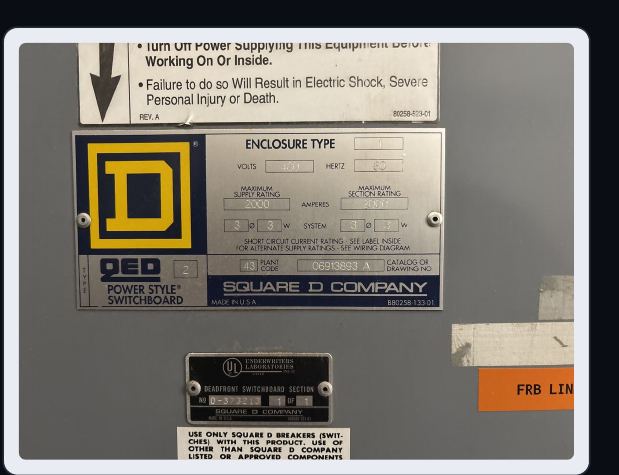
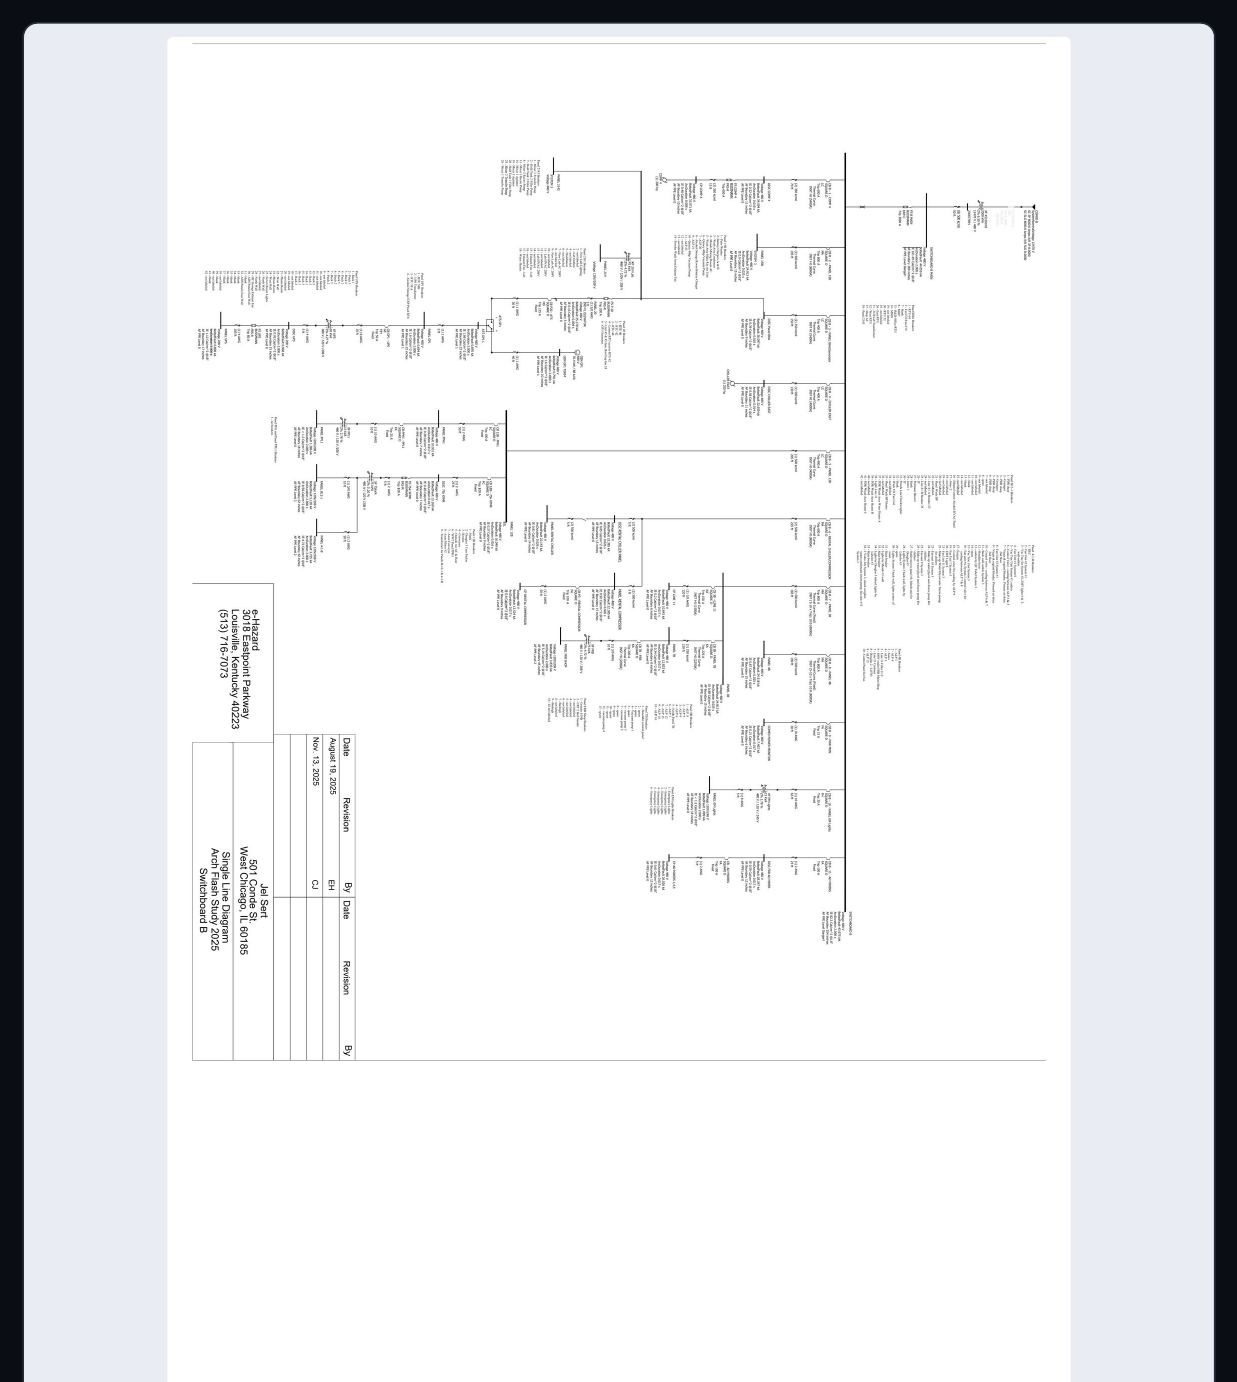
Figure 14 — Switchboard nameplate. Square D QED Power Style, 480 V, 60 Hz, 2000 A. System designation 3 phase, 3 wire — documentary confirmation of the ungrounded delta configuration on which §8.3 depends.
Drawing
Scope
Relevance to this investigation
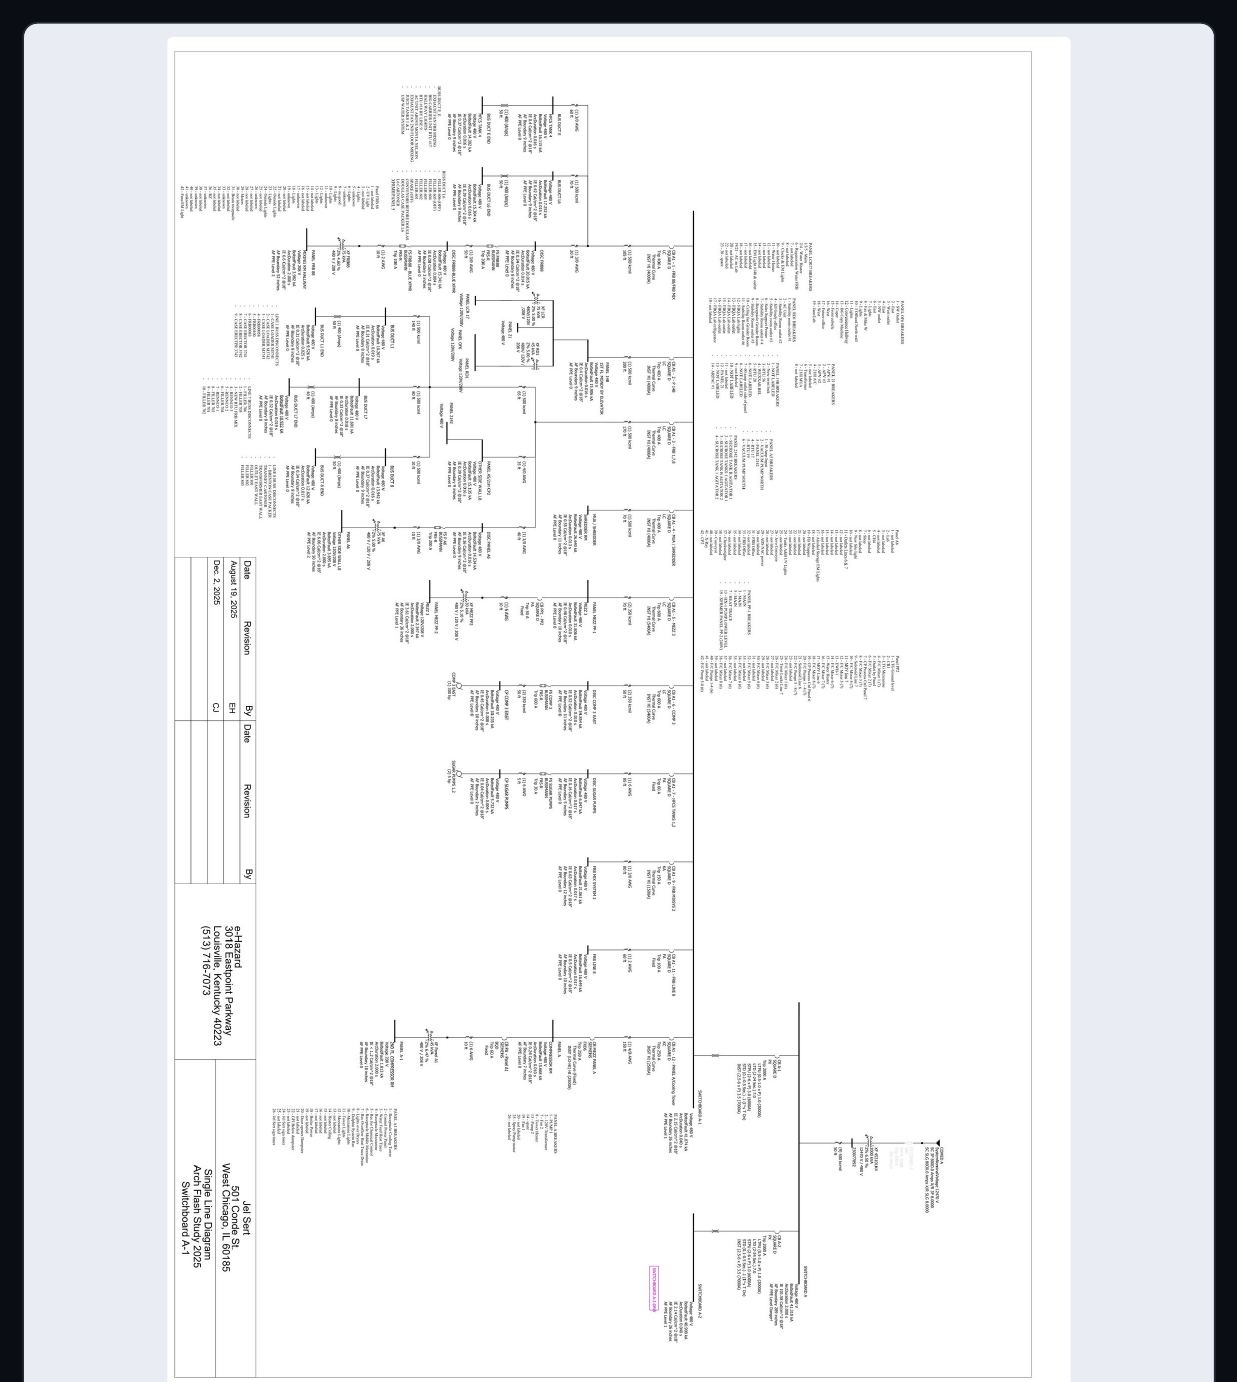
Figure 15 Switchboard A-1
ComEd service A, 12,470 V primary, 2000 kVA transformer at 6.50% impedance. Switchboard A splits to A-1 and A-2 through Square D PX 2000 A mains
Line 7 process loads appear on Panel PP-2 — the path from the measurement point to the affected equipment
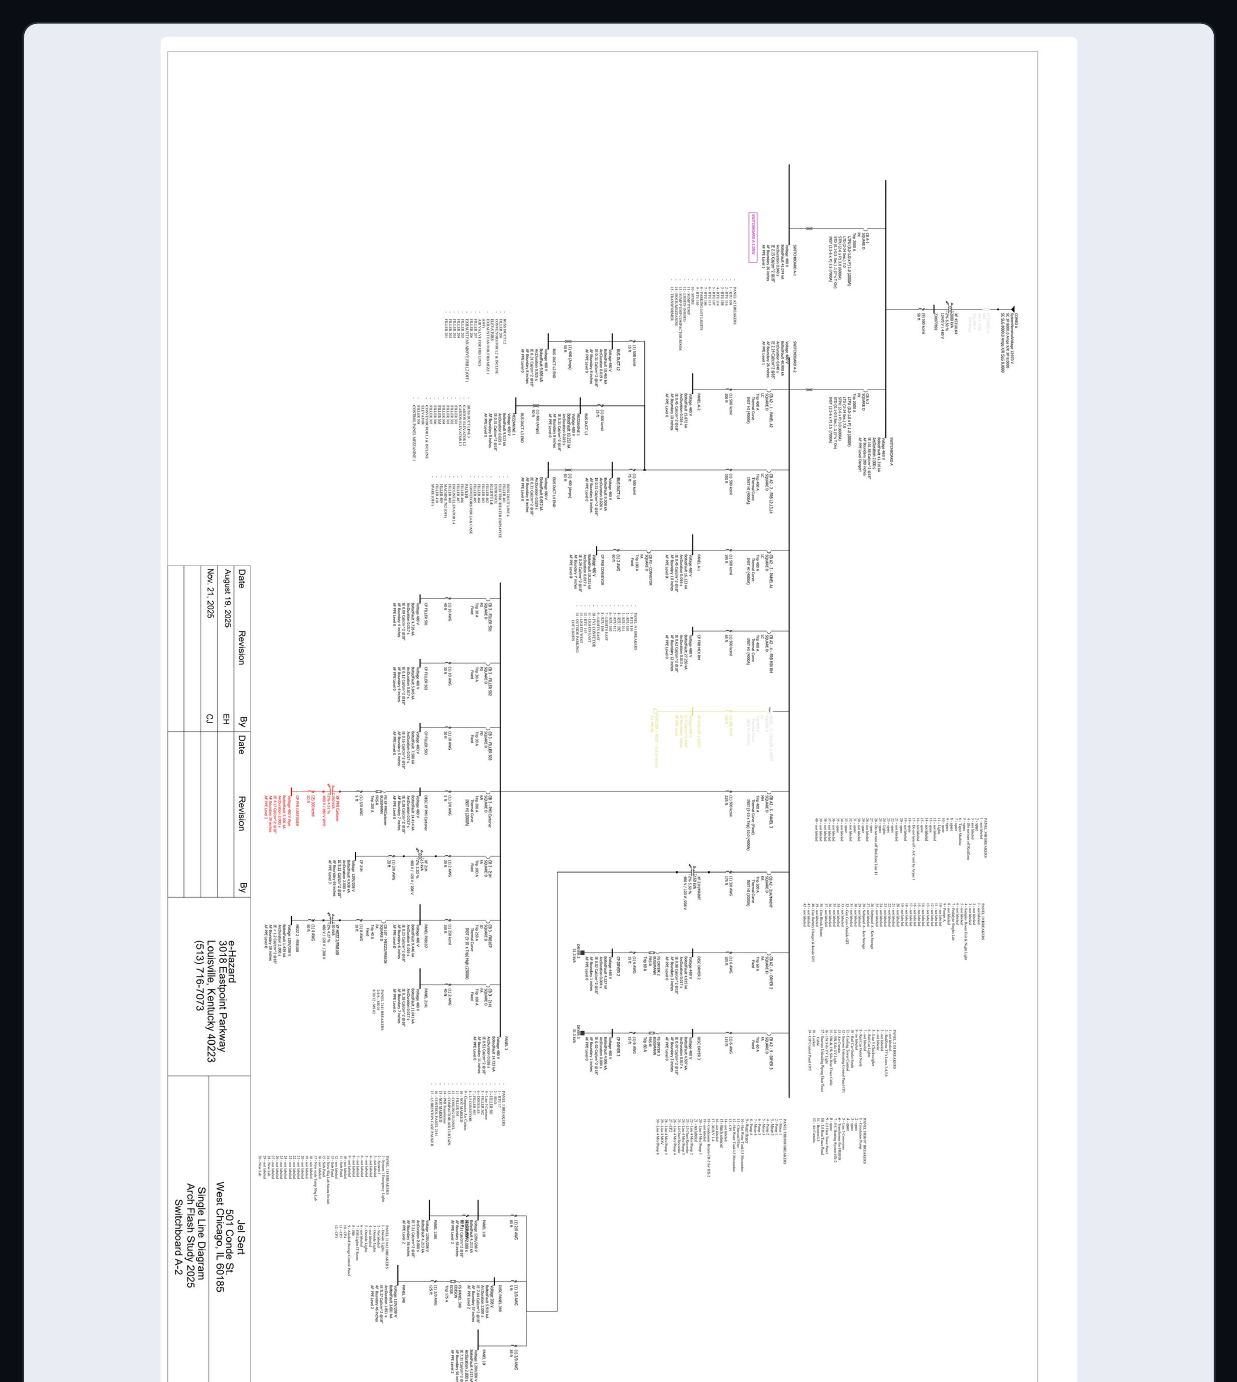
Figure 16 Switchboard A-2
Carries Lines 4 and 5 equipment including Fillers 501/502/503, the PMI cartoner and Line 4 mixing systems
Unaffected lines on the same gear — the comparison that makes Line 7's isolation meaningful
Figure 17 Switchboard B
A second, separate ComEd service with an identical 2000 kVA transformer, protected by a Bussmann KRP-C 3000 A main fuse. Carries Line 11, chillers, compressors and the generator/UPS system
Separate service, not monitored in this session
Table 10 — Reference drawing index.
Figure 15 — Switchboard A-1. Tap to enlarge.Figure 16 — Switchboard A-2. Tap to enlarge.Figure 17 — Switchboard B. Tap to enlarge.
11Open items — information required
The findings are complete to the limit of the information available. These remain outstanding and all require action or information from Jel Sert personnel, ordered by their effect on the conclusions.
SINGLE MOST IMPORTANT ITEMItem 1 — are the surge protective devices landed on the line side or the load side of the MCC bucket fuses? This one determination confirms or refutes the leading explanation for both failure types on Line 7 (§8.5). It requires an inspection, not an analysis, and it should be completed before any replacement device is energized.
11.1 Tier 1 — required to close the Line 7 investigation
1
Are the SPDs landed line side or load side of the bucket fuses? Photograph the landing.Confirms or refutes §8.5; governs the root cause statement
Maintenance
2
Photographs of the SPD installation in a bucket: connection point, lead length as installed, phase assignment, routing.Lead inductance adds to let-through voltage; excess length is itself a finding
Maintenance
3
Did the L1 fuse failure and an SPD failure occur in the same bucket at the same time, or separately?Distinguishes one mechanism from two
Maintenance
4
Installation date recorded on each of the three Line 7 SPD labels.Separates single-event failure from cumulative end of life
Maintenance
5
Was the Rennco 2 device energized and showing green during the same period Rennco 1 and 3 were dark?The selective-failure argument in §8.4 requires a like-for-like comparison
Maintenance
6
What differs physically between Rennco 1 / 3 and Rennco 2 — machine revision, controls, wiring, bucket, feeder?Most likely location of the actual cause
Engineering
7
Retain the two failed devices and the blown L1 fuse for inspection; do not discard.Physical evidence; also required for any warranty claim
Maintenance
11.2 Tier 2 — required to complete the facility picture
8
Facility-wide electrical failure history for the past year — including simple breaker trips.Establishes whether Line 7 is genuinely isolated and provides a baseline failure rate
Ops / Maint.
9
Which distribution breaker and panel feed the Rennco buckets? Photograph the breaker label.Completes the electrical path from the measurement point to the failed equipment
Engineering
10
Confirmation that no other line has experienced comparable failures.§8.1 rests on this; currently reported as "as far as I know"
Operations
11.3 Tier 3 — useful, non-blocking
11
Remaining e-Hazard single-line sheets, if any beyond A-1, A-2 and B.Completes the distribution model
Engineering
12
Warranty claim on the two failed SPDs — manufacturer terms require the claim within a limited period of failure.Commercial recovery; unrelated to technical findings but time-limited
Purchasing
STATUS OF THIS REPORT
This is a findings report, complete to the limit of the information available. On the supply side the measured evidence is unambiguous: no ground fault, one sag below 90% of nominal in 519,161 records, and capacitor switching confirmed as a cumulative contributor that cannot select one line. The Line 7 root cause remains open pending Item 1, an inspection the site can complete without further analysis; the internal issues noted in the principal conclusion require the further investigation set out in §9.2.
ENGINEERING SIGN-OFFLuke ZarakasPrincipal Energy Consultant · DarkHawk Industrial Energy
PREPARED BYDarkHawk Industrial Energy Solutions2020 Calamos Ct. Suite 200 Naperville, Illinois 60563 · darkhawkgroup.com
 INTERIM — WORKING HYPOTHESIS